Translate

DO YOU KNOW?-3

DO YOU KNOW?-3
CREATININE CHEMISTRY

Translate

Saturday 7 September 2019

SUMMARY-ECG EDUCATION-G

ECG-SUMMARY-1

1. The ECG is recorded in a graph paper which is composed of small squares with 1mm height and width. Also 5 small squires form large squires in height and width. The X-axis represents Time and the Y-axis represents electric conduction. Every small squires 1mV in height.
2. Normally the ECG machine is set up to move the graph paper 25 mm per sec in the printer. Some times this may be changed up to 50 m.m/sec.
3. Each 1mm height in the Y-axis represents 1mV.
4. A normal ECG is composed of 5 waves namely P, Q, R, S, and out of which three waves namely P, R, and T are positive upward deflections and Q and S waves are negative downward deflections.
5. The waves are identified as follows. In a normal ECG the first positive upward deflection is known as P-wave. The P-wave represents the atrial (upper chambers)contractions.
6. The P-wave is followed by a QRS complex with an interval.
7. The QRS complex is the representation of the ventricular (lower chambers) contractions.
8. In the QRS complex the first negatively downward deflection immediately followed by R-wave is known as q-wave or Q-wave according to its size. In other words a Q or q-wave is any wave which is after the P-wave deflected downward immediately before the R-wave. The Q wave represents the brief repolarization of the Inter Ventricular Septum(IVS) when a brief and weak electrical conduction is passing from left to right across the (IVS). See Fig-1 below.
Fig-1

9. After the Q-wave within the QRS-complex any immediately following positive deflection is the R-wave or r-wave according to its sizes. In other words any upward deflections immediately followed by S-wave are known as R-wave. The R-wave represents a strong ventricular contraction due to strong conduction of electricity from right to left from the Purkinje fibers, the bundle of His and across the IVS(see Fig-1)
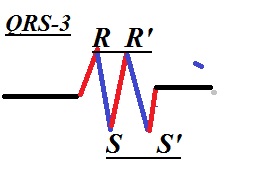
10. Then within the QRS complex a brief negative deflection immediately following the R-wave is known as the S or s wave as per its sizes. In other words any negatively downward deflection within the QRS-complex preceded by R-wave is known as S or s wave. see Fig-2 below.
Fig-2
11.After the S-wave finally the ventricles relax after a brief interval which is represented by the S-T-interval.The T-wave is the final point or completion of one normal Sinus Rhythm. The next Sinus Rhythm starts again with the next P-wave. Hence the T-P interval, the interval between two Sinus Rhythms is the real isoelectric line as this line represents zero electric conduction in any situation whereas other wave intervals may deviate from the isoelectric line in abnormal conditions. (see Fig-3)
Fig-3
12. There are 12 leads that view the heart from 12 different angles. Out of which the bipolar electrode lead II is the hero which views the heart from the left bottom ankle which is more or less falls within the normal axis of the heart's electrical activities which is at -30 degrees to + 90 degrees. See Fig-4 below.
Fig-4


In the above figure note down the limb lead, II is viewing the heart from the bottom left which is more or less in the same ankle of the normal heart axis colored yellow in the circle. Hence the ECG recorded by this lead describes 80% of the total ECG representation.
aVR lead which views the heart from the extreme right gives the least representation of the total ECG.
Any ECG can be easily read out by looking at the lead II recordings which are at the bottom of your ECG report.
Lead aVL, I, are viewing the heart from the left anterior side
Chest leads V1, V2  looks the heart mostly the right Ventricular.
Chest leads V3 and V4, are looking at the left ventricle.
V5, V6, and aVL are viewing the heart from the left lateral side.
13.If in an ECG if there are negative deflections recorded by the left leads and positive deflections at the right leads indicates that there are abnormalities in your heart. 
Fig-5
14. It is the theory of electrocardiology that if current flows towards the lead then it is recorded as a positive upward deflection in the ECG by that lead and vice versa. It is explained in Fig-5 above.

15. Axis is very important. Already we know that the axis of the heart is normally towards the downward left, southeast at an angle of 0 degrees to +90 degree. This can be seen in the ECG as +ve deflections in aVF, lead I, and II.
More commonly the normal axis is extended beyond 0 degrees up to -30 degrees from +90 degrees. This can be seen in the ECG as positive deflections in aVL, lead I and II, and negative deflection at aVF.This is shown in the following diagram. (Fig 6A)
Fig-6A


 There are three types of the deviated axis which we can observe easily in the ECG. The three deviations are illustrated in the following figure (Fig-6B) 
Fig-6B


In the above Fig 6B the 3rd diagram shows the presence of Left Axis Deviation (LAD). This can be observed in the ECG as follows:
The electrode aVL and lead-I show positive deflections and all others show negative deflections. This condition indicates that there is left ventricle enlargement and right ventricle's weakness. Also due to the left anterior fascicular block.
The 4th diagram shows the presence of Right Axis Deviation (RAD). This can be observed in the ECG as follows:-
Only electrode aVF and lead-III show positive deflections and all others show negative deflections. This condition indicates that there are a right ventricular enlargement and a weak left ventricle. Also this may be due to the right anterior fascicular block.
The 5th diagram shows the presence of Extreme Deviation which is a rare but dangerous condition. This can be observed in the ECG as follows:-
Only aVR electrode shows positive deflections. This indicates
atrioventricular canal defects. Also this may be due to extreme and heavy enlargement of the right ventricle and light and weak left ventricle. There may be a right anterior and posterior fascicular block or ventricular tachycardia.
16. Fundamentally we should keep in our mind that the augmented electrodes and the limb leads are looking the heart in vertical views and the pericardial or chest leads looks the heart in close horizontal views and concentrated towards the ventricles.
V1and V2 view the right ventricles, V3 and V4 view the interseptum and to some extend overall view, and V5 and V6 view the left ventricle. See the diagram below.
Fig-7

In Fig 7 the location of the chest leads is shown diagrammatically. From the position of the chest leads we can observe any problems in the ECG.
Any problem in the right ventricle the V1 and V2 record negative deflections.-
Any problem in the left ventricle can be clearly notified at the V5 and V6 deflections.
                                        Continued.....

Saturday 31 August 2019

MORPHOLOGY OF THE ECG WAVES-SELF-ECG EDUCATION-F

MORPHOLOGY OF ECG WAVES


  • The Article:-
This is the last and final step to expertise the ECG education after the identification of the ECG-waves.In this article we will analyze the morphology, physiology, and the pathology of the ECG-waves.

VALIDITY OF THE ECG
Fig-1

Before going into the heading first thing we must confirm the validity of the ECG. To check the validity we must see the correct placements of the leads. If the leads are wrongly placed or mistakenly interchanged then the whole ECG will appear abnormal leading to wrong diagnosis and treatment.
For example the nature of the ECG recorded by aVR electrode (augmented Voltage Right) is a mirror image of the ECG recorded by aVL and lead-II electrodes.
Because the aVR electrode is placed far right from the heart at the right-hand wrist or shoulder.Since the axis of the heart and its activities are all towards left this lead record the sinus rhythm upside down and which is normal as shown in Fig-1 above.
If in case the aVR records a normal positive rhythm instead of mirror image then there are problems either in the heart (Dextrocardia)or due to leads misplacements.
Dextrocardia means the hearts axis is abnormally rotated to the right or extreme right. Hence a proper diagnosis must be conducted by the doctor. If Dextrocardia is absent then the patient has to be sent back to the ECG room to retake the ECG with correct placements of the leads.

P-waves:-Morphology
Fig-2

P-wave totally represents the contractions of the two upper chambers(Atria). See Fig-2. The three types of P-waves have been shown with three different morphologies. Out of the three two are abnormals in appearances which are pathological.
The first P-wave is the normal one. The morphology of the normal P-wave as shown in Fig-2 is a half-circle bump above the baseline with not more than 2.5mm(<2.5ss) both in height and width. The bump has been equally halved. The right one-third of the side (R)represents right atrial contraction, and the left one-third of the side represents the left atrial contraction and the remaining curved upper portion is the combination of the right and left atrial contraction represented by (R+L).
The second P-wave is with a cone shape that indicates there is a problem at the right side of the heart. That is right upper chamber enlargement due to problem in the tricuspid valve(the valve in between the right upper and lower chambers) stenosis,(narrowing of the valve opening), or lung diseases.-Cor Pulmonale
The third abnormal P-wave. It is M-shaped or it may look like a camel hump. This is due to the left upper chamber enlargement due to the mitral valve (the valve between the left upper and lower chambers) stenosis.
QRS-MORPHOLOGY:
The following is the QRS-Complex which represents the contractions of the two lower chambers(Ventricles).
Any abnormality in the appearance or morphology of QRS represents the problems (Pathological) in the lower chambers. See below the Fig-3
Fig-3


This is a typical morphology of the QRS which describes the morphological changes during Right Bundle Branch Block (RBBB) and Left Bundle Branch Block(LBBB).
In the RBBB the right ventricle is not directly activated as it should be by the right bundle branch because there is an electrical conduction block. The left ventricle is activated by the left bundle branch and these impulses are conducted by the LV myocardium to the right which then contracted. In this ECG we can observe the rapid depolarization of the L.V along with a slowed and delayed depolarization of the R.V.This is clearly indicated by the first shortened widened QRS complex followed by a deep negative deflection as S-wave and then a steep positive upward deflection, the R'-wave. These changes can be observed in the V1 electrode which is viewing the heart from the right. The V-6 electrode which views the heart from the left records a mirror image of what V-1 records (see Fig-3-RBBB).The reason is very simple. Because it views the heart from the left side but the conduction is towards the right and away from the left.
Similarly in LBBB the left ventricle is not directly getting conduction from the left bundle branch instead it receives the impulses from the right ventricular myocardium and the contraction is delayed while the right ventricle contracts normally and quickly.
See the Fig-3 above. The V-6 lead receives positive impulses hence it records positive deflection (Fig-3)
QRS IN MI:-
Fig-4
In the above figure a typical abnormal QRS is presented. There is a deep negative deflection of the Q-wave and the ST-segment is elevated.
A normal Q-wave represents an impulse with a small magnitude passes from left to right at the intraventricular septum. The impulse is followed by a large impulse with a large magnitude passes from right to left which is represented by the R-wave.
But a deep negative Q-wave indicates that the ventricular contraction is delayed due to a blockade, because the impulse which passes from left to right very strong. The elevated ST-segment also indicates the irregular repolarization or relaxation of the ventricles. If the QRS looks with this morphology it means it confirms the presence and prediction of heart attack or myocardial infarction (MI)
QRS IN VENTRICULAR TACHYCARDIA:-
Tachycardia means elevated heartbeats per minute (<160 bpm)
Fig-5
Ventricular Tachycardia(VT)
In Fig-5 some of the recordings such as V4, V5, and V6 are omitted as they are also somewhat similar to other recordings except V-1, and V-2.
This is because V1 and V2 are viewing the heart from the right side.
aVR is recording a  positive deflection this may be due to the rotation of the heart axis towards the right extreme. Hence VT may be originated from the right ventricle.
In general, during tachycardia the heartbeats are irregular and the QR segment is wider and there are more R waves per minute. In Ventricular Tachycardia, in the ECG the QRS complex is wider than 3.5 small boxes (>0.12 seconds)
Also in VT the P-wave has no connection with the QRS.
There is a fusion of sinus and ventricular rhythms.
Torsade de Points:-
Fig-5A

If the VT if not treated properly it becomes polymorphic (very irregular) as shown in the figure above. At certain points sinus rhythm may return but soon the QT intervals widened (>500ms, see Fig-5A above) followed by irregular twitching of QRS around the isoelectric line may indicate Torsade de Points which will lead to fatal V.Fib followed by death.
QRS IN VENTRICULAR FIBRILLATION(V.F)
See the fig-6  below which is the ECG recorded by the lead-II.
Fig-6

Fig-6-A

See the above Fig-6 and Fig-6A which shows the ECG of VF recorded by lead-II. The morphology shows that there are no P-waves. The ventricles are fibrillating without any coordinations.
                                      Continued...


Monday 26 August 2019

HOW TO IDENTIFY ECG WAVES?-ECG EDUCATION-E

ECG-NOMENCLATURE

In this article we are going to study how to identify a particular wave among the important five waves namely P, Q, R, S, T.
At any time when we examine the ECG we should always note that the first wave of the heartbeat as shown in the figure should be identified as P-waves. The P-waves appear in many forms as shown below.
FIG-1
The above figure (Fig-1) note that the P-waves are in different forms. Except for the first one all three are abnormal P-waves. At the last abnormal P-wave, the P-wave is almost absent.
As we already studied from the last posts about ECG that the P-wave represents the contraction (depolarization)of the upper chambers (Atria) of the heart. Hence any irregular abnormal P-waves are seen in the ECG then it means there are problems in any one of the atria or both. If there is a conical shaped apex in the P-wave (Fig-1-1st abnormal) it means the right atrium is enlarged.
If there is an M-shaped apex in the P-wave (2nd abnormal in Fig-1) it means the left atrium is enlarged.
If the P-wave is overlaid on the baseline, disappeared, or almost absent(3rd abnormality-Fig-1) then  SA nodal blockade and atrial fibrillation must be suspected. In atrial fibrillation the P-wave is replaced by tiny irregular f-waves.
The next wave follows is the Q-wave which forms a part of the important QRS-complex.
The Q-wave can be defined in two ways.
1.Q-wave is the wave with a minute or large negative deflexion following the P-wave. or
2. The Q-wave can be defined as the wave with a small or large negative deflection which is immediately followed by the R-wave.In other words 
Any negative deflection whether it is small or large immediately before R-wave should be identified as Q-wave or 'q'-wave if it is small 
QRS-Nomenclature
As we know that the QRS-complex is the main part of the ECG so we should deal with a special for it as follows:-
Three things we must keep in our minds.
1.Position of the waves
2.Nature of deflection (+ or -)
3.Size of the deflection.
See the following figures Fig-2; and Fig-3.Fig-4; and Fig-5.
Fig-2
A normal QRS
See the above Fig-2 a normal QRS complex is displayed.
Fig-3
In the above figure (Fig-3)there is a typical QRS complex is displayed. Sometimes we come across such complicated ECGs to identify the waves.
In such cases we should always devise a common theory which states that in any QRS- complex the first negative deflection immediately before the R-waves must be named as Q or q-waves depending upon the size of the deflection. If there are more than one it should be quoted with ' (prime)
Note in the above figure (Fig-3) the Q-wave is absent as there is no first negative deflection before R-wave.
Secondly in any QRS complex any first positive deflection within the complex should be named as R or r waves with ' (prime) if there are more than one according to its sizes.
See the following another typical QRS.
Fig-4


Thirdly any first negative deflection immediately after the R-wave is the S or s waves with '(prime)
if more than as per its sizes.
In the above figure (FIG-4) again there are no Q-waves. But there are 2 consecutive positive deflections represents two R-waves (R, R') immediately followed by two consecutive negative deflections named as S and S'.
Then the nomenclature of the T-wave which represents the relaxation of the ventricles.
Fig-5
In the above figure note the position deflection of the T-wave. After the T wave, after the ventricular relaxation there is no electrical conduction up to the next cycle started by the SA-node the pacemaker. Hence the interval T-P is the perfect and absolute iso electrical line to be kept for reference.
                    Continued in next post(F)

Wednesday 21 August 2019

ECG EDUCATION--D

THE 12 LEAD ECG MACHINE

In the market ECG machines are available in various types such as 12-lead,6-lead,3-lead, and single lead types.
When we think to buy one for our home use we must first familiar with these types.
For example when we buy a 12-lead machine we should have a thorough knowledge regarding the number of electrodes (Leads) and what are the functions of each electrode and how they should be placed on our body.
See the following animated diagram for a 12-lead ECG machine:-            
                             
Fig-1
In Fig-1 we can see the various electrodes and how they are placed on a human body and brief details are given below:-

1.aVR-Lead:-This lead has been attached at the wrist below the palm at the right hand.

2.aVL-Lead:-This lead has been attached on the left-hand wrist similarly.

3.aVF(R)-Lead:-This lead has been attached at the right foot which you can see as a red dot at the right foot without naming as it serves merely as an earth connection without any further involvement in the ECG procedure.

4.aVF-Lead:-This is attached on the left foot similar to the right.

The above mentioned three unipolar leads namely aVR,aVL, and aVF are forming a triangle known as Einthoven's Triangle.

The above-mentioned triangle is shown with green lines in the above figure.

The triangle is very important as it adds three more virtual bipolar electrodes namely lead-I,

lead-II, and lead-III (Limb bipolar electrodes)

5. In the above diagram (Fig-1) the lead-I receives electrical signals from aVR, and aVL and sends it to the heart.

6. Similarly, the lead-II receives signals from the two unipolar leads namely aVR and aVF and send to the heart

7. The last bipolar lead receives signals from aVL and aVF and sends it to the heart.

Now we attached 7 electrodes out of which one is earth (aVR-F) and the three bipolar electrodes are virtual and embedded in each side of the triangle.

Now we have to place six more electrodes known as chest electrodes as per the methods given below:-
V1-electrode:4th intercostal space at the right sternal border. This means from the first rib next to the shoulder bone (clavicle) below the neck to the space between 4th and 5th ribs and right to the chest big bone(sternum)
V2-electrode:-Similar to the above lead but to the right of the sternum.
V3-electrode:-Midway between V2 and V4.
V4-electrode:-5th intercostal space at the midclavicular line
V5-electrode:-Left anterior axillary line horizontally next to V4.
V6-electrode:-Left midaxillary line on the same horizontal pane next to V4 and V5.
Now the views of the heart by the electrodes are diagrammatical as follows:-
                                 Fig-2 In the above diagram (Fig-2) there are three views such as from the anterior(upper), posterior(lower), and lateral(side) views.
aVR, I,aVL, V1, V2, V3 are viewing the heart from the upper side.
aVF is viewing the heart from the lower side
II, III, V4'V5'and V6 are viewing from the lateral sides.
Terminology:-
Electrodes-----Electrical conductor or receiver
Lead         ---- The electrical potential difference                              between two electrodes
aVR------Augmented Voltage Right

aVL ------Augmented Voltage Left
aVF ------Augmented Voltage Foot

Note:-Many times these two terms 'lead and electrode' are used interchangeably and it doesn't matter.
The bipolar electrodes are virtual and hence they are leads only.
<1 amp="" peration="GetAdHtml&MarketPlace=IN&source=ac&ref=qf_sp_asin_til&ad_type=product_link&tracking_id=pharmalatest2-21&marketplace=amazon&region=IN&placement=B07DBBBFRP&asins=B07DBBBFRP&linkId=bfdae861f246979556cf96a2d28a0bfa&show_border=true&link_opens_in_new_window=true&price_color=333333&title_color=0066c0&bg_color=ffffff" style="height: 240px; width: 120px;">


                                                           Continued in the next post (E)...

ECG EDUCATION-C-ECG AXIS

AXIS OF HEART ON ECG

The axis of the heart in the ECG is the main direction of the overall electrical conductions of the heart. It is very easy to assess the QRS axis which is the electrical depolarization of the ventricles. Since the total mass of the ventricles represents 90% of the total mass of the heart assessing the QRS axis can give us the knowledge of almost all of the heart problems. The QRS axis can be easily observed at the lead-II column because the lead II is fixed very near to the ventricles. This column is separately mentioned at the bottom as the last column in the ECG paper
P-axis may give us some figures for the problems in the atrium only which is 1/8 that of the heart problems.
Hence we are going to concentrate more on the QRS axis in the following article.
Normally all the electrical activities of the heart are directed towards -30 degrees to +90 degrees in a quadrant as shown in the diagram below:-
Fig-1
In the above diagram (Fig-1) the circle has been divided with two crossed pairs of diameters perpendicular to each other to form 4 main quadrants.
For the illustrative purposes these 4 quadrants have been subdivided into sub-quadrants with 30 degrees radians each.
In Fig-1 if the axis (Yellow) is shifted to the left (-30 to -90) then it is known as Left Access Deviation (LAD) which indicates that there are problems in the left ventricle such as hypertrophy or a fascicular block.
Similarly if the axis is shifted to the right side then it is known as Right Access Deviation (RAD) which indicates there are problems in the right ventricle.
Normal ECG:- In the above circle (Fig-1) the leads I, II, and aVF lie in the normal yellow region. Hence in the ECG graph if the QRS complex is positive in the lead-I and II column and aVF column then we can confirm that the ECG is normal with normal ventricular depolarization and the axis of the electrical activities are normal.
Abnormalities:- In the above circle aVL lies on the quadrant between -30 to -90 degrees.
Hence in the ECG columns of lead-I and aVL shows positive QRS and column aVF shows negative QRS then there is LAD which indicates there are problems in the left ventricle.
Similarly if column I shows negative QRS, and the columns of aVF and the III-lead shows positive QRS then there is RAD.
If both column I and aVF shows negative QRS then there is an indeterminate axis which means extreme deviation. 

How to be Familiar With ECG Columns

                             
Fig-2

See the above graph. When you have received your ECG report you may notice on your ECG graph which will look like the one shown above. (Fig-2)
Descriptions as follows:-
1)I-column:-This shows the deflection QRS by the I-bipolar electrode or lead
2)II-column:-This shows the QRS axis deflected in the II-bipolar electrode or lead
3)III-column:- This shows the QRS-axis deflected in the III-bipolar electrode or lead.
4)aVR column:-This shows the QRS deflection at the aVR-unipolar lead.
5)aVL-column:-This shows the QRS axis deflected at the aVL-unipolar lead.
6)aVF-column:-This shows the QRS axis deflected at the aVF-unipolar lead
7)V-1 column: This shows the QRS deflection at the 1st chest lead
8)V-2-column:- This shows the QRS deflection at the 2nd chest lead.
9)V-3-column:-This shows the QRS deflection at the 3rd chest lead.
10) V-4-column:-This shows the QRS deflection at the 4th chest lead.

11)V-5-column:-This shows the QRS deflection at the 5th chest lead.
12)V-6-column:-This shows the QRS deflection at the 6th chest column.

                                                Continued next...

ECG ABNORMALITIES-ECG EDUCATION-B

ECG ABNORMALITIES

Before we go into the subject we must observe some parameters in the ECG.

AXIS OF THE ECG

The axis of the ECG is the major direction of the overall electrical conductions of the heart.
This we can see in the next post in detail.
First of all we must know about the columns in the ECG.
There are 12 columns in your ECG chart. Ignore the first three columns namely 1) aVR- V1- V4; 2)aVL- V2- V5; 3)aVF- V3- V6.
Note the last column which is Sinus Rhythm or Lead II- column. 
In this column you can observe three things namely normal sinus rhythm, sinus bradycardia, and sinus tachycardia. Any of the last two if present then your ECG is abnormal.

Fig-1

1. Normal Sinus Rhythm:-(See Fig-1)

In this the heart rate is normal (60 to 100 bpm), all R-R intervals are equal in length.
The P- wave appear normal (not over 2.5 mm or 2.5 ss)in height, and (not more than 0.12 sec or 3ss) in width. The P-wave represents the two upper chambers (Atria) contraction (Atrial Depolarization)
The QRS complex which represents the contraction of the lower chambers (Ventricular Depolarization)
The P-R interval is the length at the beginning of the upslope of the P-wave to the beginning of the QRS complex and normally it must be 0.12 to 0.20 seconds or 3 to 5 ss.
The normal duration of the QRS complex must be between 0.08 to 0.1 sec or 2 to 2.5 ss.
The amplitude of the R-wave in the sinus rhythm-II column should not be more than 20mm or less than 4 LS.
The QT interval(From the beginning of the Q-wave to the apex of the T-wave should not be more than 2 large boxes or 0.4 sec.
The ST interval fits and overlaps over the isoelectric line and its length is not over 0.08 sec or 2ss.
2. Sinus Bradycardia:-(See Fig-1)
    This can be identified from the ECG by calculating the HR which is <50 BPM.
The RR intervals are elongated
If still the waves are regular then it may not be worried and it may be temporary conditions due to lack of body movements.
3. Sinus Tachycardia:-(See Fig-1)
    This can be identified by calculating the HR which is above 130 BPM. Again if the waves are regular then this too not to be worried as it may be due to over activities such as sports, exercises or work overloads

PATHOLOGICAL OR ABNORMAL ECG 

Fig-2


1.Atrial Fibrillation(See Fig-2)
Examine the P-wave and the PR interval
In atrial fibrillation the P wave is almost absent or invisible and the QRS complexes are irregular as shown in the diagram above. (Fig-2)
Clinical Symptoms of A-fib:-
1.Palpitations with feelings of difficulties with racing flip-flap speed of the heartbeat.
2.Tiredness and weakness
3.Headache
4.Breath short
5.Chest tightness and pain
Atrial fibrillation also occurs if there is Sinoatrial Exit Block means the conduction is blocked and cannot exit out of SA node. A prolonged SA node exit block (III degree block) can cause cardiac arrest.
Some times or infrequently if there is a negative U-shape deflection that immediately follows the T-wave and if it is prominent then it means there is suspected hypokalemia (low potassium), or hypercalcemia(high calcium) or hyperthyroidism.
2. Atrial Flutter:-(See Fig-2)
In Atrial flutter the ECG shows many P-waves as in the diagram.
In atrial flutter the atrium is stimulated irregularly by the SA node.
Clinical symptoms of A-Flutter:-
Very similar to A-fib with less severity.
3.AV CONDUCTION BLOCK
There are three degrees of AV conduction blocks.
The symptoms are as follows:-
1. The heart rate slows down
2. Some times it may not be worried but many times it may be fatal.
3. In the ECG the P-R intervals are elongated to such a limit after which the P-wave and R-waves have no connections at all and the condition is the third-degree AV block.
4.Irregular Heartbeats
5.Syncope and dizziness
6.Chest pain.

Fig-3

4. Ventricular Tachycardia:-(See Fig-3)


Ventricular Tachycardia is the fast heart rhythm with ventricles contracting and relaxing very fast and equal to exceed 100 bpm. Because of ventricles' fast actions the atrial actions are masked and hence there are no visible P-waves. The heartbeat is so fast so that it has fewer chances to be filled with blood.
In VT randomly any two or three beats may be normal with clear P and T waves.
Symptoms of V.T:-
1.Neck tightening
2.Palpitations
3.Nausea and vomiting
4.Headache
6.Dizziness
5. Ventricular Fibrillation:-(See Fig-3)
Ventricular fibrillation is very similar to ventricular tachycardia but more serious than VT because in V.F the ventricles beat irregularly and faster than in VT and incoordinate to fill in and pump out the blood.VF if not treated immediately may lead to cardiac arrest and death.
Symptoms vary similar to VT.
6.Atrial Enlargements:-(See Fig-3)
From the ECG the appearance of the P-wave will indicate the presence of enlargements on either or both the atria. (see the diagram above)
The cone-shaped P-wave apex may indicate there is an enlargement in the right upper chamber (right atrium) 
Causes and symptoms:-
1. The tricuspid valve which is in between the right atrium and ventricle may be damaged.
2.Due to right ventricular failure.
3.Pulmonary hypertension -High pressure in the pulmonary artery.
4.Breathing difficulties
5.Palpitations
6.Arrhythmias
The M-shaped P-wave apex is the indicator of left atrial enlargement 
Causes and Symptoms:-
1.Due to the mitral valve regurgitation, stenosis, and damage
2.Left ventricle failure
3.High B.P
4.Atrial fibrillation
5.Heart failure
6.Fluid build-up and weight gain
7.Breathing difficulties
8.Palpitations.
7.Myocardial Infarction (Heart Attack)(Fig-3)
The ECG changes are as follows:-
1.T-waves are elevated (Hyperacute T-waves)
2.Elevated ST intervals
3.Followed by negative T-wave deflection
4. Finally negative large deflection of Q-wave occurs.
Ischemia develops due to a block of blood circulation and oxygen supply to a portion of the heart muscles. If this ischemia is mild and reversible the can recover its coronary blood supply.
But if the ischemia is severe and irreversible then heart cells will die which leads to MI.
Symptoms Of MI
1.severe, and crushing chest pain
2.Sweating due to sympathetic stimulation
3.Vomiting
4.Shock with decreased B.P, paleness, panic, weak pulse
5. Arrhythmias followed by ventricular fibrillation and collapse.

                                                   Continued...


ECG EDUCTION-A-ECG BASIC-

ECG INTERPRETATIONS


An ElectroCardioGram or ECG (more frequently as  EKG in which K replaces C which represents the first letter of the German word 'Kardio') is the testing of electrical conductions through the heart muscles (Myocardium) which describes the regular 'SINUS RHYTHMs' and the heartbeats in the form of line waves which can be recorded graphically.
In this article we can study all the basics of how to interpret the ECG.
Fig-2
All ECGs are recorded in graph papers that contain large and small squares. Every large square is composed of five small squares. These squares represent seconds.
Each small squares are 1 m.m in width horizontally by which we can calculate the width of the large squares as 5 mm horizontally.
The horizontal axis (the X-axis) represents time. Every 1mm square in the X-axis(the time axis) represents 0.04 seconds and every large square represents 0.04 x 5⇔0.20 seconds.
The above calculations are based on the ECG machine speed which is set up to move the ECG paper by 25 mm per second.
The vertical Y-axis represents the electrical conductions that can be recorded in millivolts and which are in the form of positive and negative deflections.
The positive deflection is the one which deflects upward and above the isoelectric line-the X-axis.
On the contrary the negative deflection is the one which goes down below the isoelectric line.
An isoelectric line is the one in which there are no deflections or electric conductions and that is a brief resting position in between two conduction cycles and that is usually represented by the T-P interval which we will understand in due course.
Again the vertical Y-axis contains the dependent variable the cardiac electric deflections in millivolts which can be calculated as follows.
On a standard ECG paper a deflection of the pointer above or below the isoelectric line with 10 small squares represents + or - 1 mV provided that each small square has a width of 1mm.
That is 10mm above or below deflection =+ or - 1mV.
From a normal ECG we can study so many important health parameters including arrhythmias and other heart problems such as atrial fibrillation, atrial flutter, ventricular fibrillation, myocardial infarction(MI), heart rate, normal sinus rhythm, sinus bradycardia, and sinus tachycardia etc.etc.
A normal adult heartbeat is 80 to 100 bpm. (beats per minute)
The normal range is from 70 to 100 bpm.
For a newborn baby it may be between 90 to 160.
A beat or rhythm is a full ventricular depolarization or contraction, which is the systole represented by the QRS complex in the ECG graph. The QRS is followed by a brief gap to another small bump deflected above the isoelectric line which is the T-wave.The T- wave is the end of one full sinus rhythm.T-wave represents the ventricular repolarization or relaxation.
T-P interval is the resting interval in which no conduction which represents the isoelectric line. The isoelectric line goes until the next cycle begins at P-wave which represents the atrial depolarization, the diastole.
To calculate the heart beats per minute you have to do the followings:-
We already know that the speed of the ECG is 25mm per sec. That means,
                            1 sec   = 25 mm
                            60 sec = 25X60=1500 mm
 Hence 1 min =1500 mm or 1500 small squares
We know that 5 small squares constitute one large square and hence in one minute 300 large squares are moved in the ECG. Count the number of R-waves which represent the heart rate per minute by this 300 sq.method.This 300 is the magic number that we can use to find out our heart rate in the standard large square method. There is another method known as a 6-sec method which we will see later.
            Before we perform any of the above two methods we must confirm that the ECG is normal with regular sinus rhythms. To do this first you take an empty white strip of a paper. overlap the strip exactly to coincide with the ECG and mark with a pen any one of the completed sinus rhythms or any of the two consecutive R-R intervals to find out all R-R gaps are equal to each other. This can be done by overlap the mark upon one by one of the following R-R intervals. If the mark fits exactly on all the R-R intervals then we can say the ECG is normal with regular sinus rhythm.
Now we can proceed with the large square method to determine the heart or pulse rate.
Method-1:-The Large Square Method:-
Spread your ECG on the table.
Count the number of large squares between any two consecutive R-R intervals.
Divide 300 by this number,
The result is your heart beats per minute.
Method-2-The Six seconds Method:-
In this method the ECG must be taken in a 6-second strip paper. Note that there are three lines on the upper part of the strip for every 6 seconds. Count the number of R-waves within these 3 lines  (6 sec) and multiply the number by ten which gives the heartbeats per minute.
This method is useful even if your ECG is not normal.
The 6-second gap can also be calculated as follows:-
Assuming that the speed of the ECG is 25mm/sec.
Accordingly we already noticed that in one minute 300 large squares have passed.
hence                                 1 min = 300 large sq.
                                    (ie) 60 sec= 300 large sq
                              then for 6 sec = 30 large sq
Hence mark down the gap which includes 30 large squires.
Now count the number of R-waves within this gap and multiply it by 10 which will yield the heart rate in beats per minute.

General Nomenclature of an ECG:-

In this section we can find the naming of the ECG parts.

Normally an ECG is appearing like this.

    
Fig-3

In the above diagram we can observe various conductions and their relationships with a normal ECG.
The electrical responses of the various parts of the heart muscle can be classified briefly as follows:-
0-Phase:-In this phase sodium ion flows inwards rapidly into the myocardial cell and depolarizes it the muscle contracted which is represented by elevation in the graph (see diagram)
1-Phase: -A short but powerful drop-in which all sodium ion gates closed and there is a powerful outflow of potassium ion from the cell with the exchange for the chloride ion which flows into the cell and the myocardium repolarizes and relaxes (note in the above diagram this phase is absent in SA and AV nodal conductions.)This phase is present only in the Purkinje fibers that are the ventricular response. This means the ventricles after a shoot up contraction undergo a brief relaxation which can be evidently seen in the ECG as S-wave at the QRS complex.
2-Phase:-This is the phase very prominent and important in the electrophysiology of the heart. In this there is a continuous potassium ion efflux and calcium ion influx to form a plateau in the cardiogram. In the above diagram you can notify this plateau as the S-T interval in ECG.
3-Phase:-In this phase the calcium ion gates are closed and continuous efflux of potassium ion. This is the rapid repolarization or relaxation of the ventricles which can be seen in the ECG as T-waves.
4-Phase:-This is diastolic depolarization in which the ventricles are ready for another cycle. The resting phase is maintained by continuous potassium efflux and slow sodium and calcium ion influx. This is represented in the ECG as the isoelectric line.
FIG-4
At the beginning of the heartbeat first the conduction starts at the SA (Sinoatrial)- node which is situated at the top right corner of the right atrium (right upper chamber) of the heart. Sinoatrial node is the pacemaker to start the heart rhythm. It spontaneously depolarizes with a slow response and spread the electrical conduction to the left atrium and down to the ventricles.
The diaphragm which separates the atria from the ventricles is totally inert and will not respond to electrical conduction. Hence the conduction from the SA node goes to the AV node directly.
But before it reaches the ventricles the conduction is paused for a while by the AV (atrioventricular) node which briefly takes time to decides to send the conduction down to the lower chambers are not. This is represented in the ECG as the P-R or P-Q interval. The AV node is situated at the left bottom of the right atrium and just above and very near to the center of the two ventricles.

Up to the AV node the muscle responses to the conduction are slow in order to give enough time to the AV node to decide.

Once the AV-node comes decided it responds quickly and passes the conduction to the Bundle of His, which is situated at the top-bottom junction of the two ventricles or at the inferior end of the internal septum to the ventricles. (See the figure-4 above)

The bundle of His quickly responds to the conduction and passes it to its branches on either side. The branches then pass it quickly and finally to the Purkinje Fibers which holds the two ventricles. The conduction passes to the ventricular muscles which depolarize quickly and powerfully contract with a sound 'dup'.The ventricular contraction is the powerful one that overshadows the atrial repolarization or relaxation. The ventricular contraction is represented by the QRS complex which masks the atrial relaxation in the ECG. You can note from the above figure the QRS complex is the main part of an ECG which exactly at the overshoot region of the Purkinje fiber (ventricular) response drawn above the ECG (See Fig-3 above)

Now we will go back to the P-wave the first part of the ECG.

From the above figure (Fig-3) the P-wave is the region represented by the atrial contraction(depolarization) which is slow and deflect to a small part just above the isoelectric line (X-axis or Time-axis)

We have already seen that the atrial relaxation (repolarization) is masked in the QRS complex.

Now come to the end portion which is the T-wave in the ECG. The T-wave represents ventricular relaxation (repolarization).

We can summarise these waves as follows:-

1.P-wave-Atrial contraction

2.P-Q interval-A brief pause at the AV-node

3.Q-wave-The brief preparation of the ventricular muscles to overshoot

4.R-Wave-Ventricular Contraction, the overshoot phase.

5.S-wave-after the systole brief repolarization followed by a diastolic depolarization to reach the isoelectric line.

6.S-T-interval-The resting phase before the ventricle relaxes.
7.T-wave:-Repolarization of the ventricles followed by the diastolic depolarization of the atria for the next P-wave cycle.
8.T-P interval-The The isoelectric line.
A brief Terminology:
1.Depolarization-means contraction of the muscles
2.Repolarization-means relaxation of the muscle.
3.Systole-Ventricular contraction (atrial relaxation)-R-wave (QRS -Complex)
4.Diastole-Atrial contraction -P-wave
5.Ventricular relaxation-T- wave
                                          Continued in the next 


A brief explanation regarding to 'Depolarization' and 'Repolarization'.


BRAIN MAPPING

BRAIN MEANDERING PATHWAY                                                                         Maturity, the thinking goes, comes with age...